

From complex data to compelling stories: How a market leader made its insights impossible to ignore.
We'd put so much work into the research, but the most important findings weren't always getting through.
Now our clients are actually talking about the findings and coming up with ideas about what they could do with them. The best part is we don't have to explain everything first!
That's the kind of impact we've always wanted our work to have.
Alex, Insights Director at a market-leading organisation.
What started as a challenge to communicate complex research became a way to make expertise more visible, elevate how the business is perceived and strengthen its position as a leading voice in the industry.
HERE'S THE FULL STORY
When Alex first came to us, the research wasn't the problem. Getting people to see its value was.
His team had spent weeks analysing data, uncovering trends and building reports full of valuable insights.
Getting that value across to clients was another story.
I remember presenting the findings and spending half the meeting explaining the charts. We had so much to share, but people weren't really seeing what made it important.
Reports were packed with data. Charts showed the numbers. Presentations covered all the findings.
That's when we started asking different questions:
-
What's the most important thing the data is telling?
-
Why should readers care about it?
-
What could people do differently once they see it?
Alex realised they didn't need to show everything to communicate the value of their research.
They needed to bring the most important findings to the
surface.
That's where our approach starts: uncovering the story behind the data and finding the clearest, most impactful way to bring it to life.
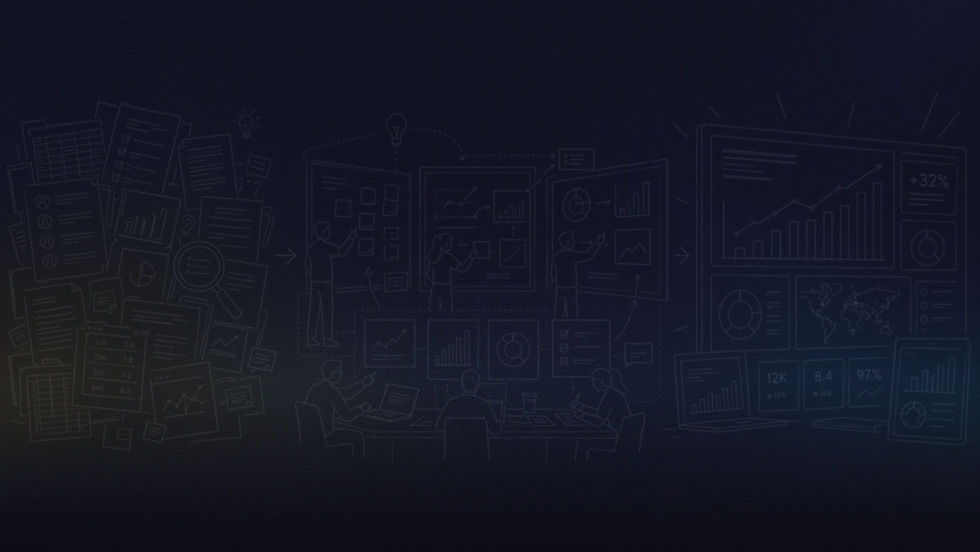
THE TRANSFORMATION:
Same research.
A whole new perspective.
Before: Valuable findings buried in dense reports, charts and too much information.
After: Compelling visual stories that brought the important insights to life and made their value clear.
When I saw the first redesigned pages I thought, that's it! That's what we've been trying to get across.
We hadn't changed the research, but suddenly you could see the important things at a glance.
What a difference!
We didn't change the research. We changed how people experienced it.
Working with Alex and his team, we looked at the story behind the numbers and found ways to make the important findings stand out.
-
We identified the insights that mattered most and brought the key messages into focus.
-
We explored different ways to visualise the data, from bar and pie charts to bubble charts, or something completely different, choosing the format that best communicated each finding.
-
We developed impactful statements and infographics that brought the story behind the numbers to life.
-
We created a clearer flow that helped audiences connect the findings and see the bigger picture.
The data that once needed several minutes of verbal explanation could now be communicated through a strong visual or a clear statement.
That changed how Alex's team could use the research.
Instead of spending the conversation explaining the information, they had more room to explore ideas and opportunities with their clients.
The value had always been there. Now people could see it for themselves.
So far, so good. The research looked completely different, the important findings were much clearer and the team loved the result. But looking great on a page is one thing. What happens when you put it in front of a client?
This time, the conversation was different.
We were presenting the findings to a client, and instead of having to explain every chart, people started talking about what they were seeing.
Someone pointed out an opportunity we hadn't even got to yet.
One of the most valuable findings in Alex's research had previously been presented through several charts and pages of supporting information.
The data was accurate, but its meaning wasn't that obvious.
Working together, we explored different ways to communicate the value behind the data.
Instead of asking people to interpret several sets of numbers, we chose one visual that made the key comparison clear. And of course, we made sure it had the kind of design quality that makes people stop and pay attention.
When Alex's team presented the findings, the client spotted the important point straight away and started discussing what it might mean for their business.
The conversation moved from explaining the information to exploring the opportunity.
That was exactly the outcome that Alex had been hoping for.
GREATER INFLUENCE:
More than a report. A stronger voice.
Before, I sometimes felt we were doing all this great work and then having to convince people why it was important.
Now they can see it for themselves.
It's great to see people recognising us for the expertise we've always had.
Something else started to change as Alex and the team shared more of their research.
The presentations and reports weren't just communicating findings anymore. They were showing clients the depth of expertise behind them.
And believe me, in a market full of information, that makes a huge difference.
Every time someone engaged with an insight or used it to explore an opportunity, they were also seeing what the team could bring to the table.
Alex told us that some clients were starting meetings by talking about insights they remembered from previous reports. Before he could even get into the meeting agenda, they were already talking about ideas they wanted to explore further.
Over time, that helped strengthen how people saw the business. Not just as a source of information, but as a respected voice with valuable expertise and a perspective worth listening to.
The expertise hadn't changed. But how people experienced it had.
What we enabled
Visible value.
Make the important insights visible.
Opportunities.
Spark ideas that move people forward.
Stronger authority.
Strengthen market perception.
What started with one important finding became a different way for Alex and the team to share their knowledge and expertise.
By combining the right visual choices with stronger messaging, we helped bring complex information to life and make its value easier to see.
That's visual storytelling in action. And the part we love most? Seeing people take those insights beyond the report and turn them into conversations, ideas and opportunities.
For Alex, the result went beyond individual reports. The research was opening up more opportunities for meaningful conversations, helping clients explore ideas and giving the business more ways to demonstrate its expertise.
The real change wasn't just how the information looked. It was how the research helped people move forward, while strengthening the business's position as a voice worth listening to.
When your insights move people forward, your business moves forward too.
Note: This story is based on a real client engagement. Names, roles, dialogue and certain details have been adapted to protect client confidentiality while preserving the challenges, work delivered and outcomes.
